At night, electricity demand rose across the island at once
As the off-peak night period began, electricity consumption increased simultaneously in multiple Nushima households. One major cause was electric water-heating equipment starting under time-of-use tariffs.
On isolated islands, the cost of transporting and supplying liquefied petroleum gas is reflected in retail prices. LPG was expensive on Nushima, and in the areas we observed directly, conversion to all-electric homes was extremely widespread.
When water heating, cooking, cooling and heating are concentrated in electricity demand, individually rational responses to the tariff can create a new system peak during the night. In 2012, Nushima was already displaying the demand structure now emerging in a more extensively electrified society.
Thirty-minute values show how much electricity was used.
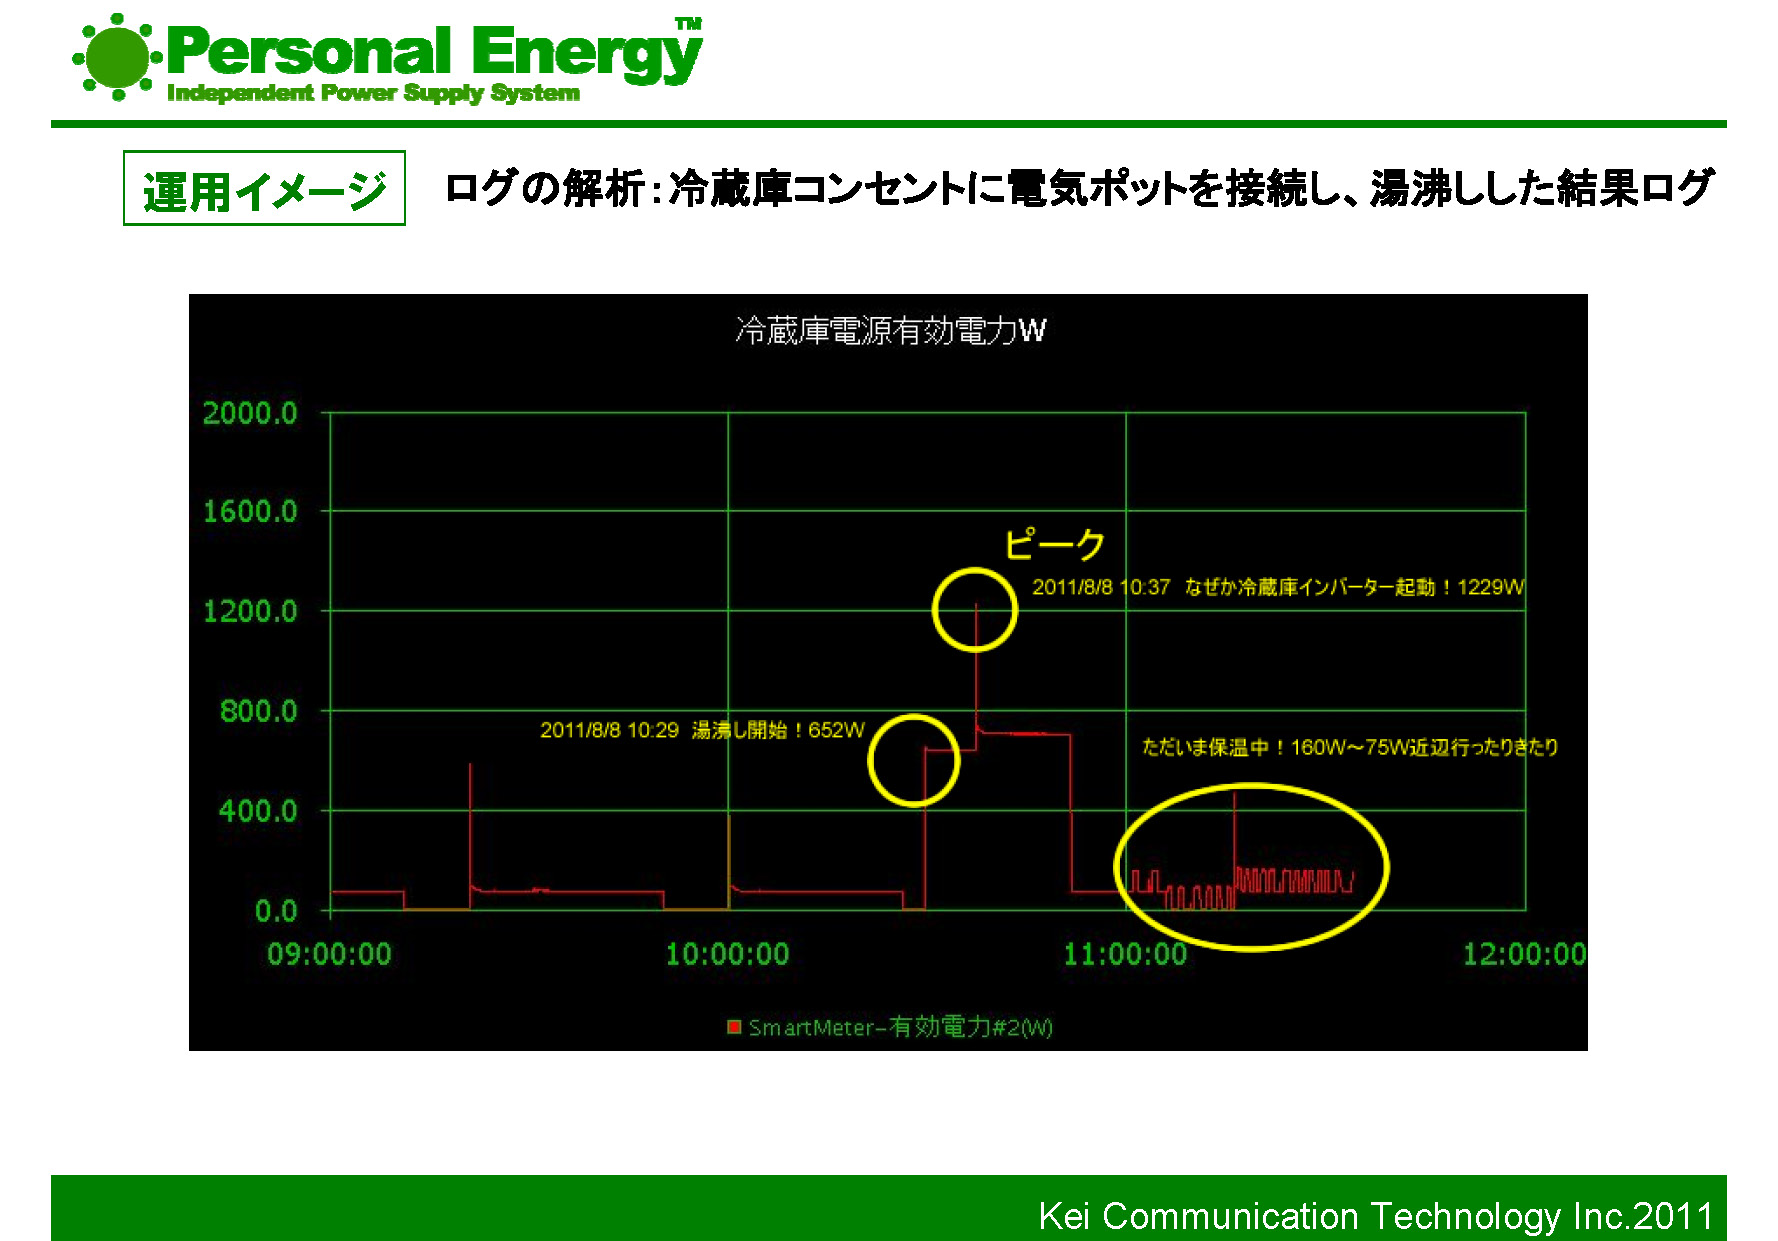
One-second values show what moved, when it moved and how the demand developed.
The 2012 vision for an Environmental Future Island across Awaji
The Nushima project began under the Ministry of the Environment's FY2012 Program for the Development and Demonstration of Global-Warming Countermeasure Technologies. Its formal theme was the demonstration of an autonomous, distributed energy system using direct-current technologies in an isolated island and fishing village.
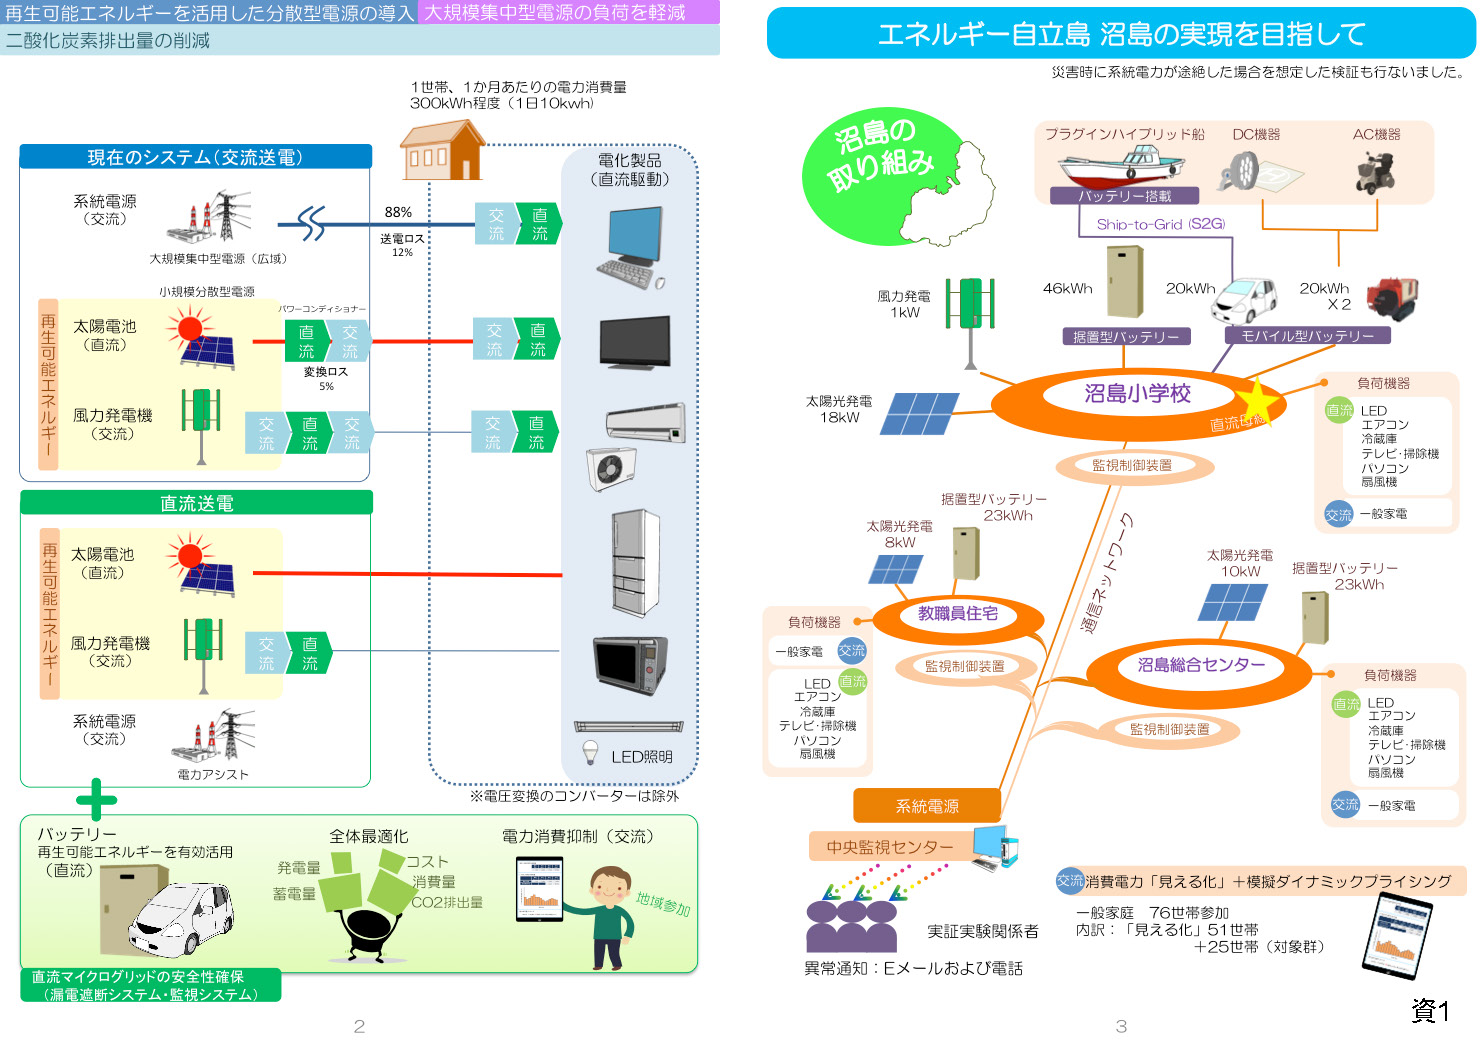
The broader policy background was Hyogo Prefecture's Awaji Environmental Future Island initiative. The concept combined solar generation, batteries, DC distribution, visualization of electricity use and demand management to turn Awaji Island into an advanced regional-energy model.
The year 2012 followed the Great East Japan Earthquake and the Fukushima Daiichi nuclear accident. Dependence on centralized generation, electricity-supply availability and local use of renewable energy had rapidly become major policy and social issues.
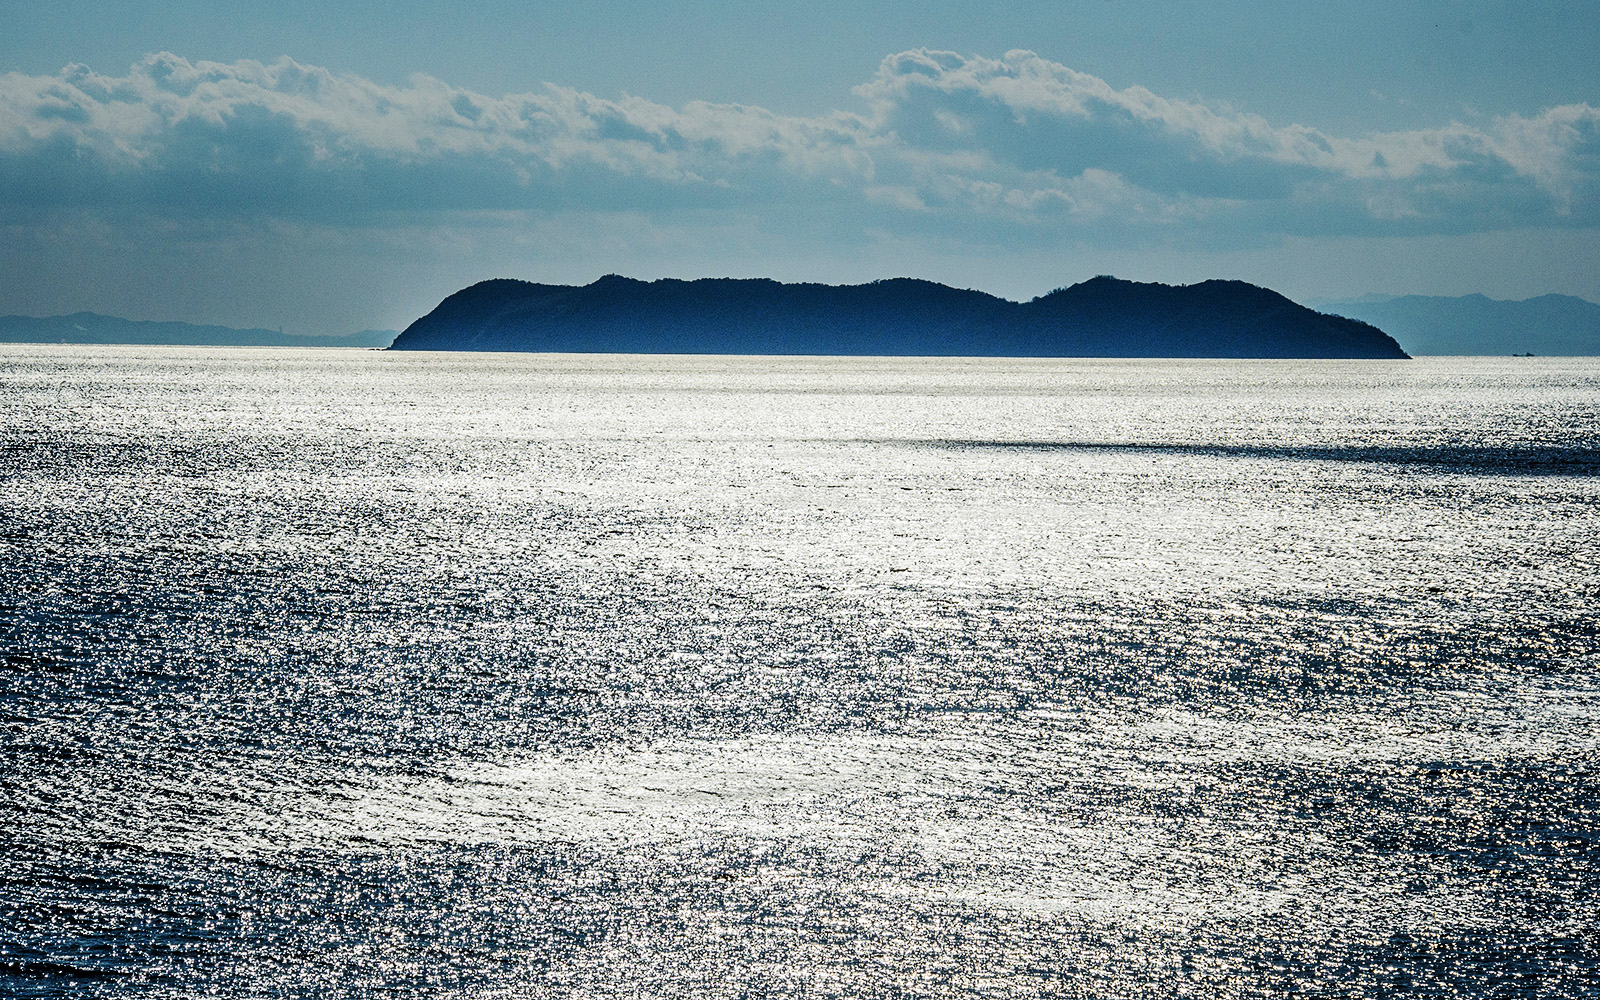
Why Nushima, rather than the whole of Awaji Island?
Nushima was not selected solely because it offered ideal conditions as an isolated island. According to contemporaneous records kept by our project personnel, Kansai Electric Power strongly opposed cooperating with a detailed electricity-measurement demonstration across the whole of Awaji Island and stated that it would not participate in that wider plan.
Public scrutiny of electric utilities was severe immediately after the nuclear accident. There was caution about allowing third parties to measure and analyze detailed demand structures. During our discussions, concern was also expressed that anti-utility sentiment could spread across Awaji Island if the demonstration covered the entire island.
The broader Awaji-wide concept was consequently narrowed, and the field demonstration was conducted on Nushima, separated from the main island. Kansai Electric Power does not appear in the Ministry's list of joint project participants and was not a research partner in the project.
- Nushima was the demonstration field
- Kansai Electric Power was not a joint project participant
- Historical monthly data were provided with household consent
- The utility's Kobe branch was acknowledged for limited cooperation
- Strong opposition to an Awaji-wide demonstration
- A cautious position on publishing detailed electricity data
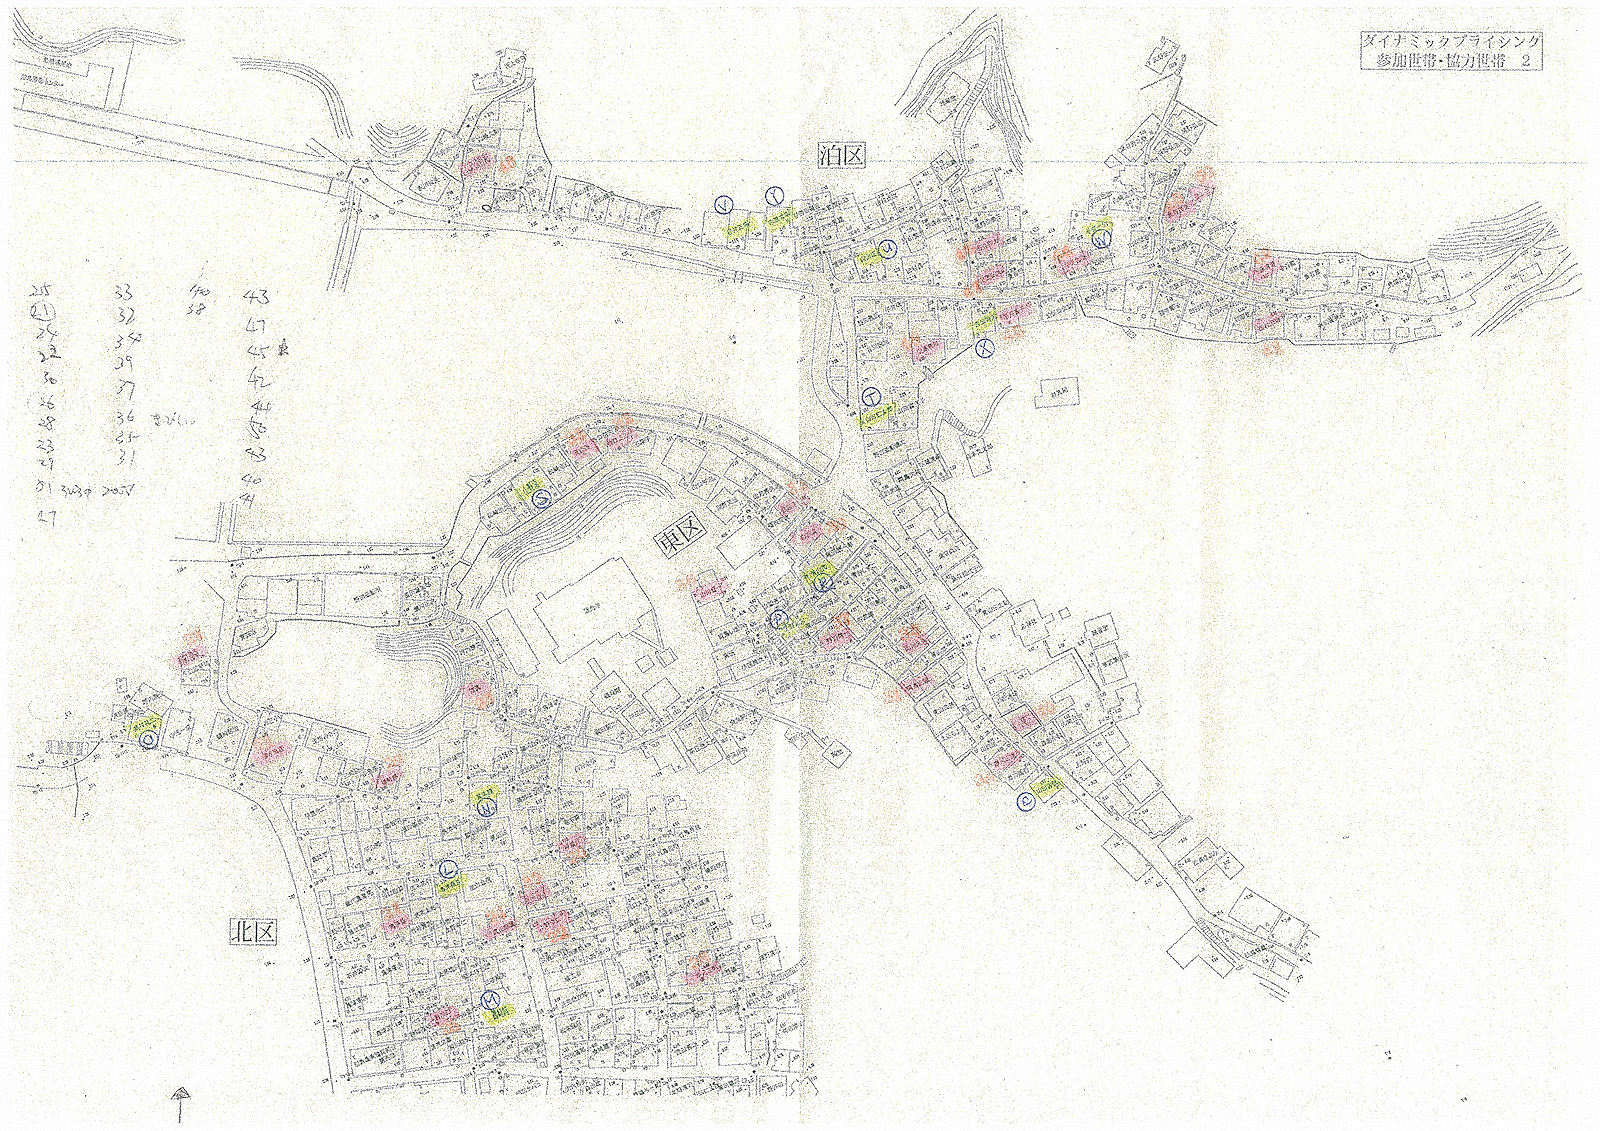
- Local coordination for meter connections at all 51 points
- The process for removing meter seals and connecting independent meters
This section distinguishes facts confirmed in public documents from first-hand records of our personnel who handled the field design, installation and utility coordination.
Connecting generation, storage, measurement and communications as a research partner
Kobe University served as the lead organization. Participants included Ritsumeikan University, the Hyogo Prefectural Institute of Technology, Fuji Electric, Sanyo Electric, Osaka City University and Kei Communication Technology.
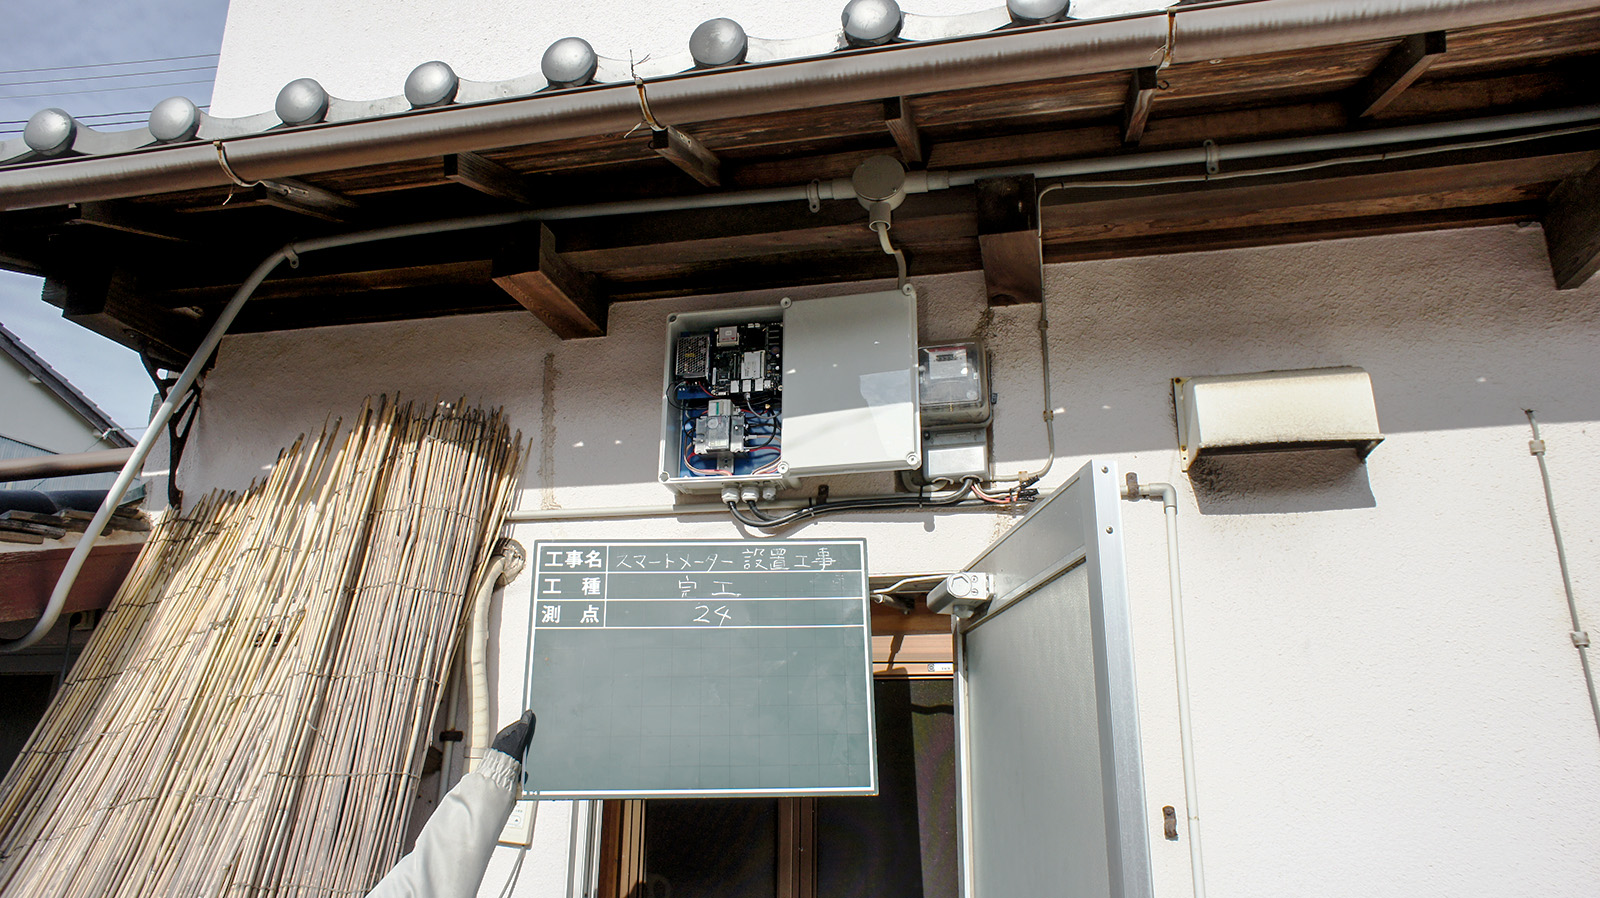
As a research partner, Kei Communication Technology built the Smart Meter systems at 51 locations, communications, data collection, our data-center infrastructure and tablet displays. We also supplied solar panels and Personal Energy to the local branch office.
The 51 Smart Meter systems (Japanese) incorporated our in-house SNMP protocol stack and MIB. Measurement values and device status were managed within a common framework and transmitted through 3G and VPN connections to our data center for remote monitoring, retention and visualization.
Our representative, Takao Awata, was also a co-author of the paper published in the international journal Energies. The Author Contributions statement identifies Koji Shimada, Yuki Ochi, Takuya Matsumoto, Hiroshi Matsugi and Takao Awata as having conceived, designed and performed the experiments.
| Participant | Primary role |
|---|---|
| Kobe University | Lead organization, systems research and overall integration |
| Ritsumeikan University | Dynamic pricing and behavioral/economic analysis |
| Hyogo Prefectural Institute of Technology | Technical coordination and links between research institutions and companies |
| Kei Communication Technology | Metering, communications, data center, field installation, solar generation, Personal Energy, and experimental design and execution |
Measuring 51 points independently of the utility
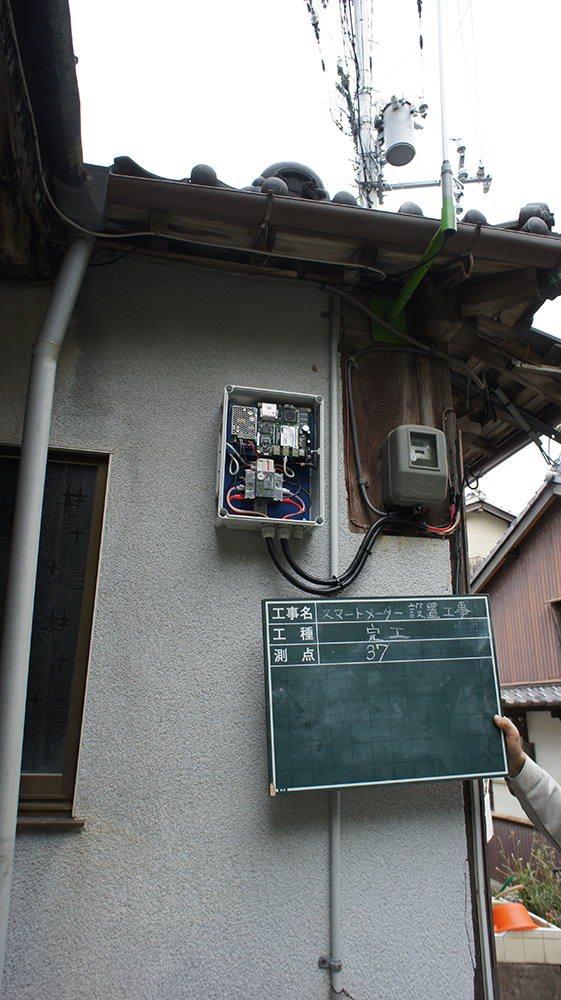
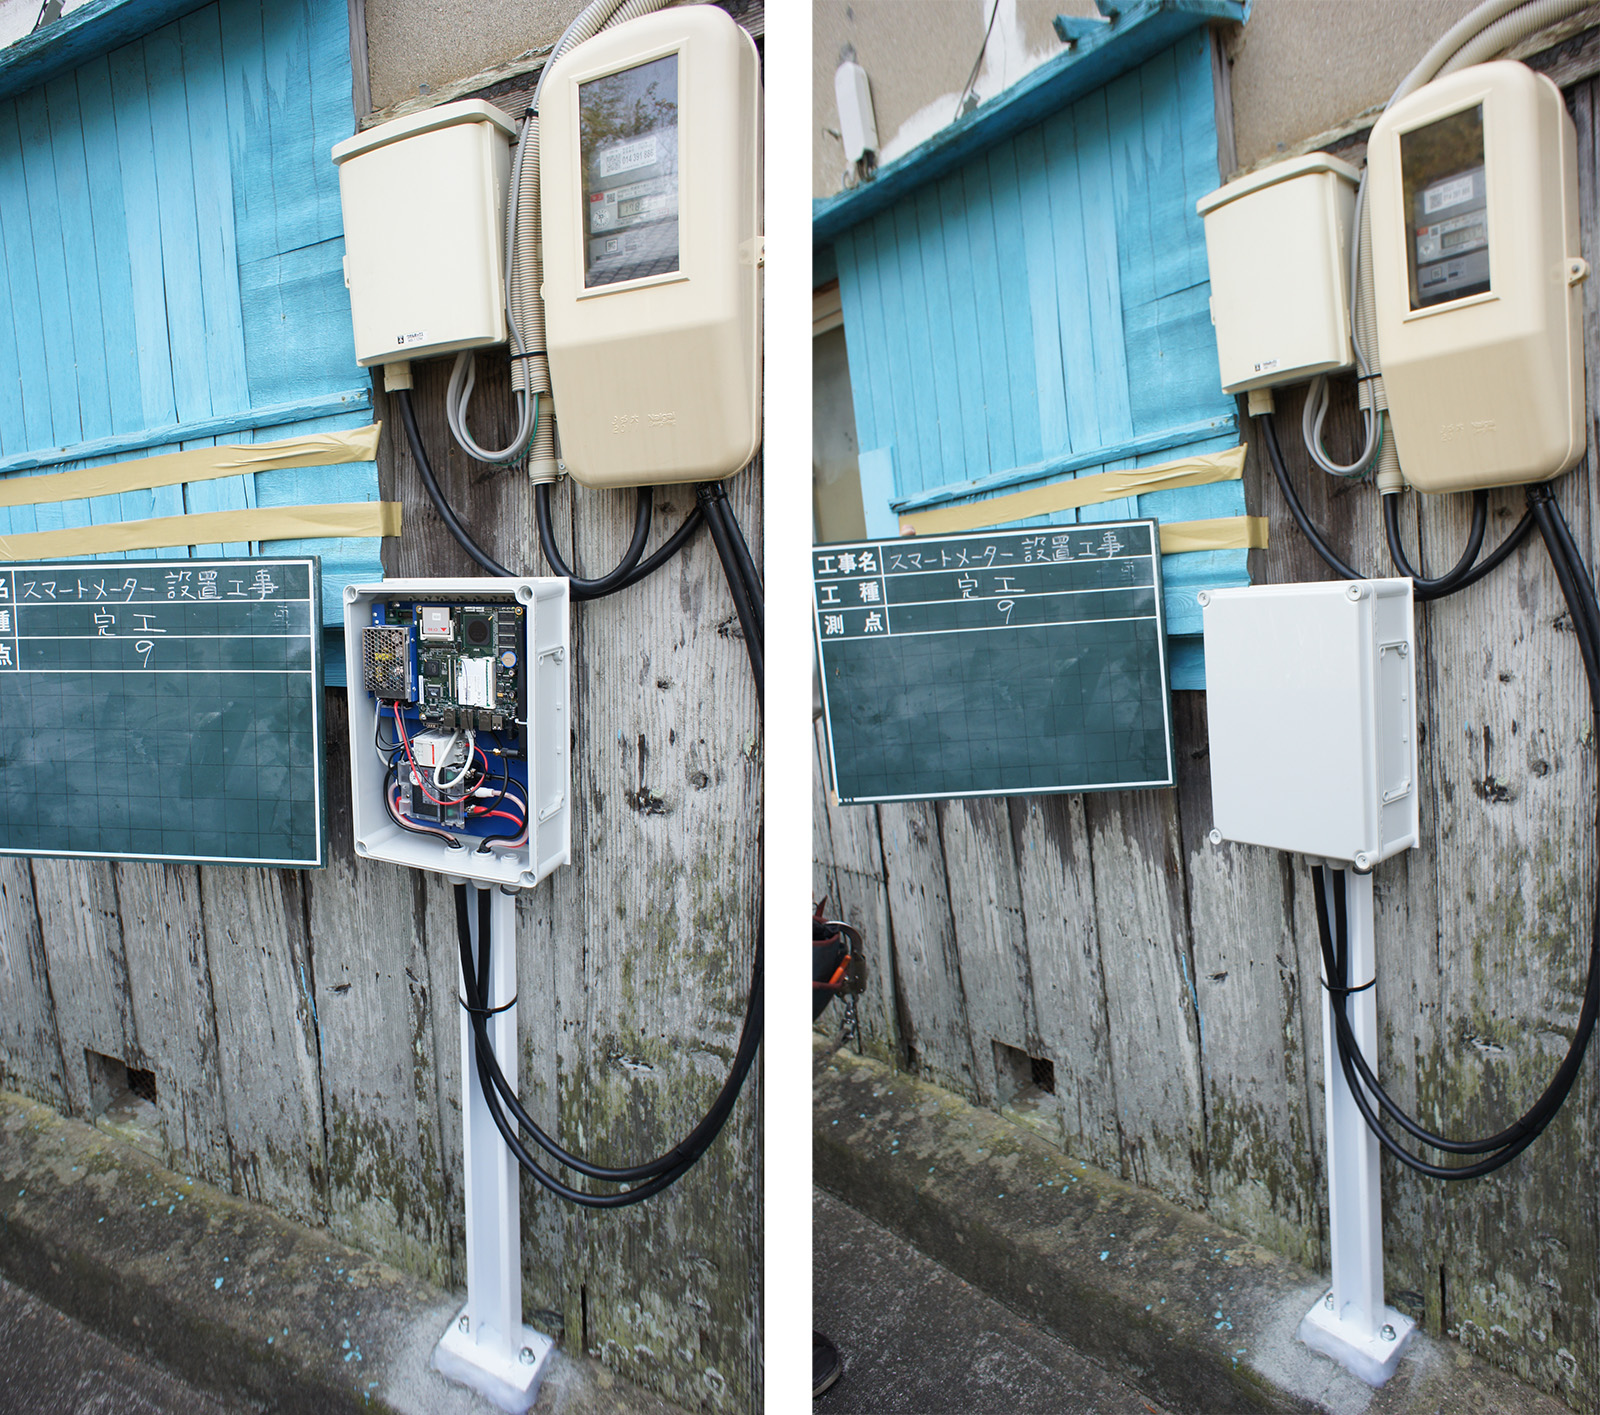
Kansai Electric Power was not a joint project participant, and there was no mechanism for continuously supplying detailed real-time data from the utility's systems to the research team. We therefore installed an independent digital certified electricity meter at each participating household and measured the demand ourselves.
Our installation records show that connection methods were discussed with the local utility office for all 51 installations. Following the required procedures, the seal on the existing meter was removed and the demonstration meter was connected so that the same whole-house load could be independently measured from the supply side.
The project report also records the final installation of smart meters at 51 households and the parallel use of a digital certified meter alongside the utility's legally certified revenue meter. It described the measurement arrangement as unusual even on a national basis.
Utility service entrance
        ↓
Same whole-house load
        ├─ Utility certified meter (billing and transaction use)
        └─ Demonstration digital certified meter (research and analysis)
                    ↓
               Smart Meter
        ├─ In-house SNMP protocol stack
        └─ Custom MIB
                    ↓
               3G / VPN communications
                    ↓
               Kei data center
                    ↓
       Remote monitoring, retention and visualization
In this architecture, Smart Meter acted as a managed node that consistently collected and monitored measurement values and device status across 51 locations. The project is a representative implementation of SNMP-based device management extended from communications equipment into electricity measurement and energy operations.
A central lesson from Nushima is that energy users must be able to measure through their own equipment and retain their own primary data.
Thirty-minute values do not reveal what actually happened
Current utility smart meters can transmit metering information to customer-side HEMS and EMS equipment through the B-route. First-generation meters were designed primarily around accumulated electricity values at 30-minute intervals, while also providing values such as instantaneous power and current.
Second-generation smart meters, whose rollout began in 2026, can in some supported configurations transmit one-minute accumulated energy through the B-route. Even so, data provided for billing, meter reading, equipment operation and basic visualization are not equivalent to research-grade primary data continuously retained from 51 locations over a common time axis.
A 30-minute accumulated value compresses everything that occurred within the interval into one number. The same reading of 2 kWh could represent a 4 kW load running for 30 minutes, an 8 kW load running for 15 minutes, or several devices starting in sequence. The result does not distinguish them.
| Comparison | Utility smart-meter data | Nushima demonstration data |
|---|---|---|
| Primary purpose | Meter reading, tariffs, network operation and visualization | Research, demand analysis, control and reconstruction |
| Typical accumulated energy | 30-minute values; some second-generation meters support one-minute values | One-second values retained continuously over the long term |
| Time alignment | Depends on meter and communications specifications | Authenticated and recorded on a common time axis |
| Equipment starts | Generally not identifiable from 30-minute values | Can be inferred from changes in the measured waveform |
| Cross-household synchronization | Depends on the retention of continuous histories | Comparable on the same time axis |
| Reanalysis | Limited by the data provided and retention period | Can be rerun from retained primary data |
The temporal resolution of one-second data is 1,800 times finer than 30-minute data. The material difference is not graph detail; it is whether the process that created the demand remains observable.
Installing solar power and Personal Energy® at the branch office
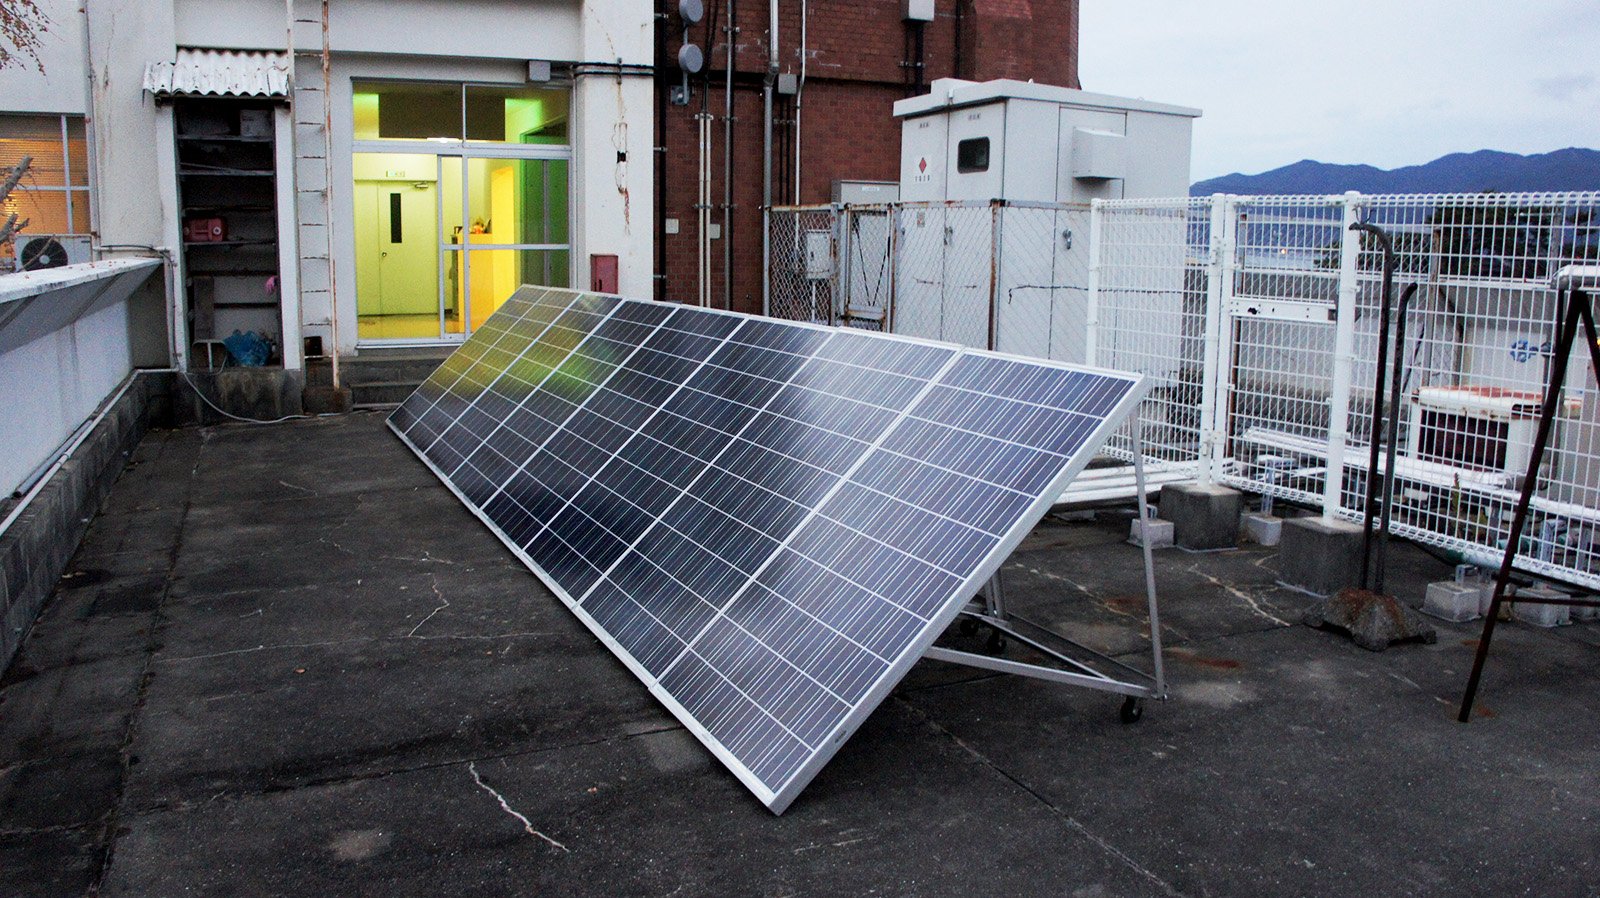
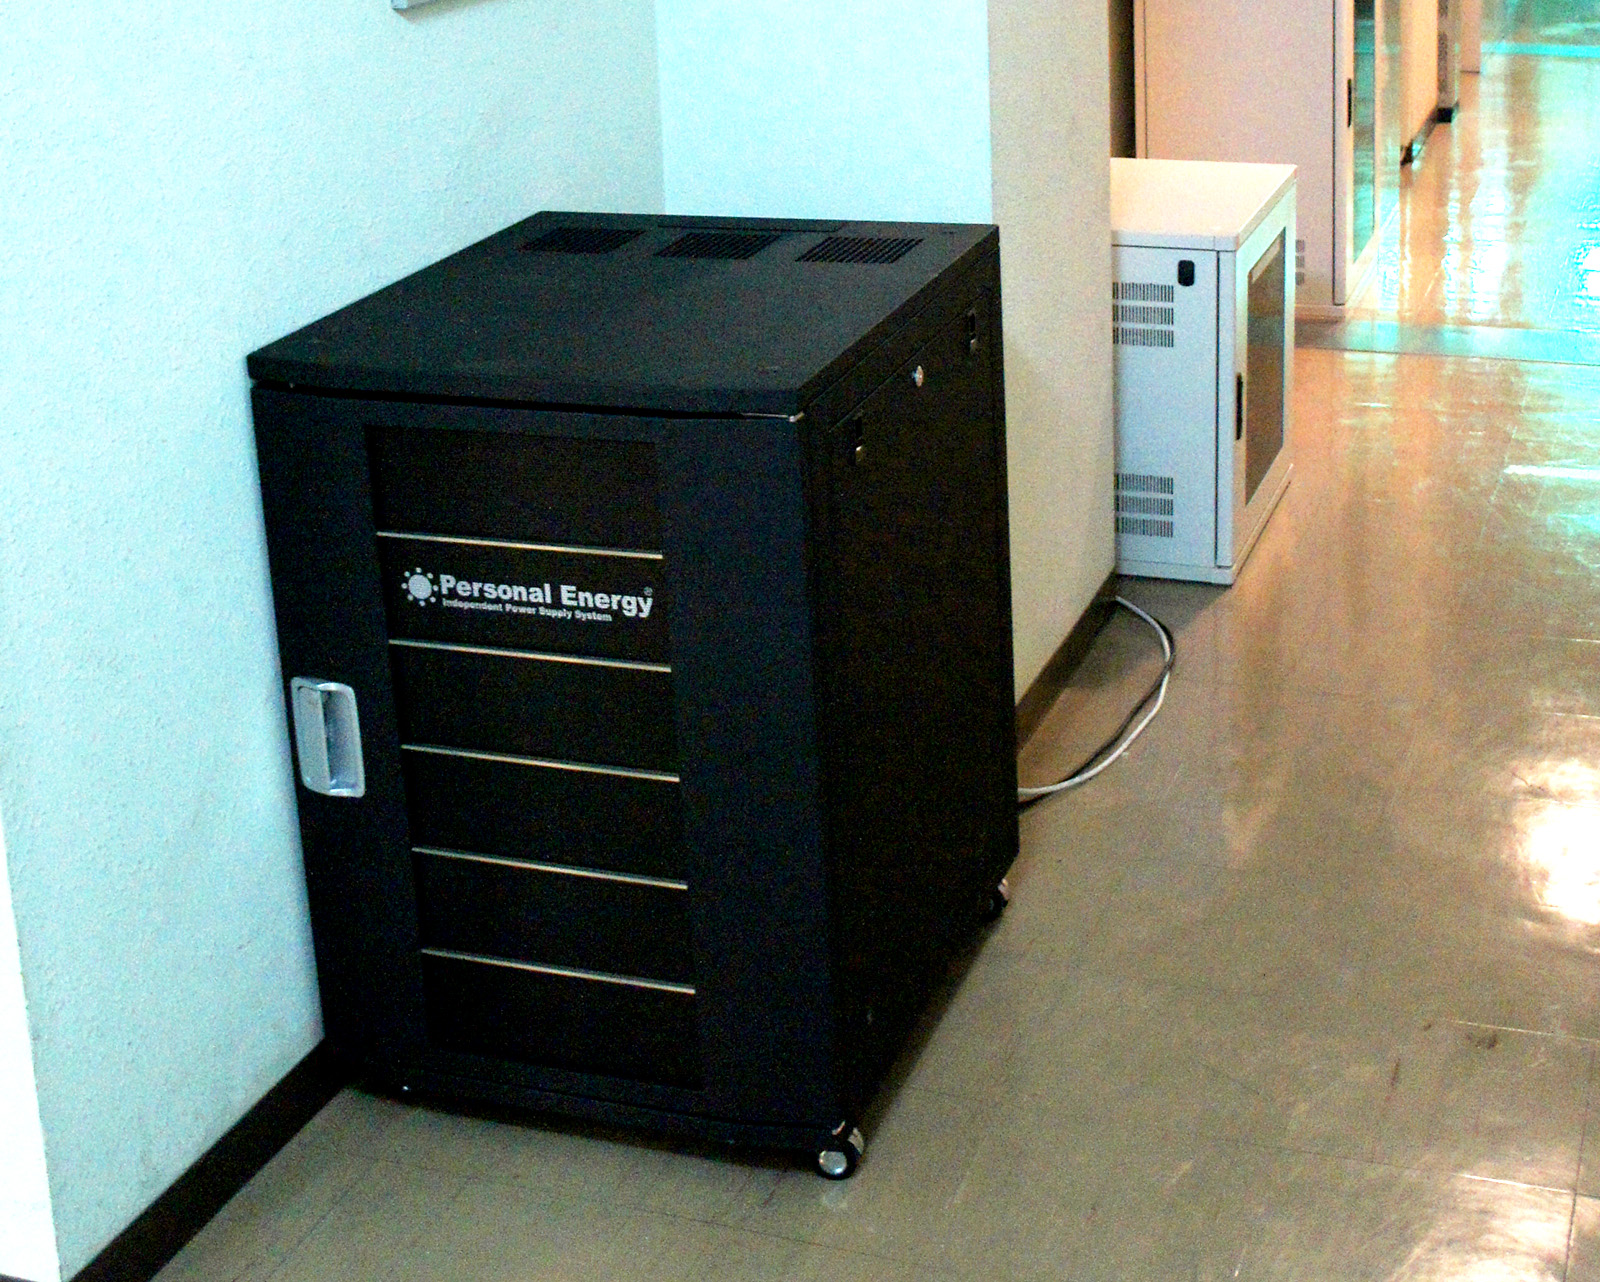
In addition to residential measurement equipment, we supplied solar panels and the Personal Energy® off-grid system to the Nushima branch office.
The branch-office system created a simulated environment combining solar generation, battery charging, inverter power conversion and supply to loads. It generated measurement data for the generation and storage side of the project.
Actual demand from the 51 measurement points and generation, storage and supply data from the branch office could be placed on the same time axis. This enabled simulation of the solar capacity, storage capacity and demand reduction required for island-wide expansion.
Branch office: solar generation ─┐
Branch office: charge/discharge ─┼─ Common time axis ─ Island-wide supply-demand simulation
51 points: measured demand ──────┘
Primary data defined by one-second records, authenticated time and certified meters
The value of the Nushima data does not lie only in its volume. Each observation was recorded at one-second intervals and aligned to a common, authenticated time base.
The meters performed internal electricity calculations at 20 millisecond intervals and accumulated those measurements into one-second records. The one-second values were not estimates produced by allocating a later 30-minute total; they were derived directly from high-frequency measurement.
Electricity was measured not by an uncalibrated clamp sensor or a reference-only device, but by digital electricity meters certified under Japan's measurement-law framework. These meters were separate from the utility's revenue meters used for transactions and billing, but their electricity values had been verified through certification.
Equipment starts, stops, cycling and short-duration demand shifts can be analyzed.
Data can be processed in parallel by location and period, then recombined accurately on the same time axis.
Whole-house loads were measured directly by an independent meter rather than estimated.
Note: Measurement-law certification applies to statutory quantities such as active electrical energy. It does not mean that every supplementary value, including voltage, current and power factor, was independently certified under the same statutory process.
Synchronized night demand created by widespread electrification
In areas that use city gas or LPG alongside electricity, electricity data alone cannot capture all energy used for water heating and cooking. Because all-electric homes were widespread on Nushima, a large part of residential energy demand appeared directly in the electrical load profiles.
When electric water heaters using off-peak tariffs started during the same time window, rational peak shifting by individual households created a synchronized community-wide peak.
This remains a central issue for demand response. Sending the same price signal to every customer does not necessarily flatten demand. It can move the load collectively to another time.
- At what hour, minute and second did water-heating equipment start?
- How closely were start times synchronized across households?
- Where would the peak move if tariff periods changed?
- How much could staggered control reduce the peak?
- What charge-discharge schedule would best combine solar generation and batteries?
Reading air-conditioner starts from temperature
Previous studies combined electricity demand with temperature and wind data from the Japan Meteorological Agency. They statistically examined cooling degree, heating degree, household size, refrigerator count, commercial freezer count and all-electric tariff status.
Returning to one-second or one-minute data makes it possible to examine responses lost in daily or hourly averages. Analysis can estimate the outside temperature at which each household started air conditioning, the delay between temperature change and operation, and the cycling pattern after startup.
Separating price response, temperature response, automatic equipment control and building thermal characteristics could support not only energy policy, but also heat-risk prevention, welfare monitoring and equipment-degradation detection.
Visualization and dynamic pricing
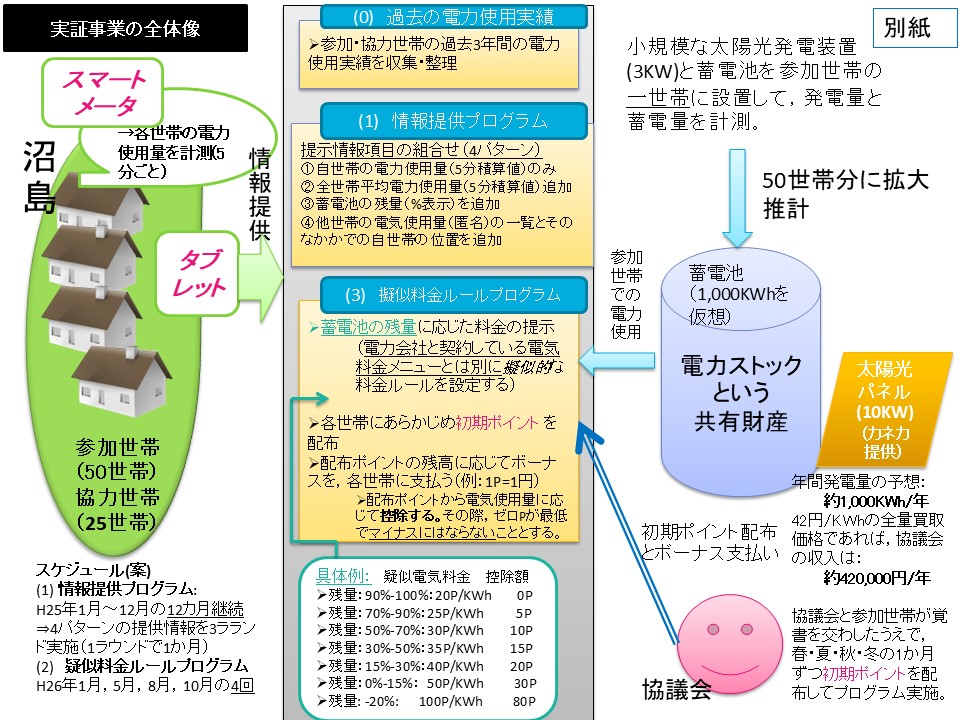
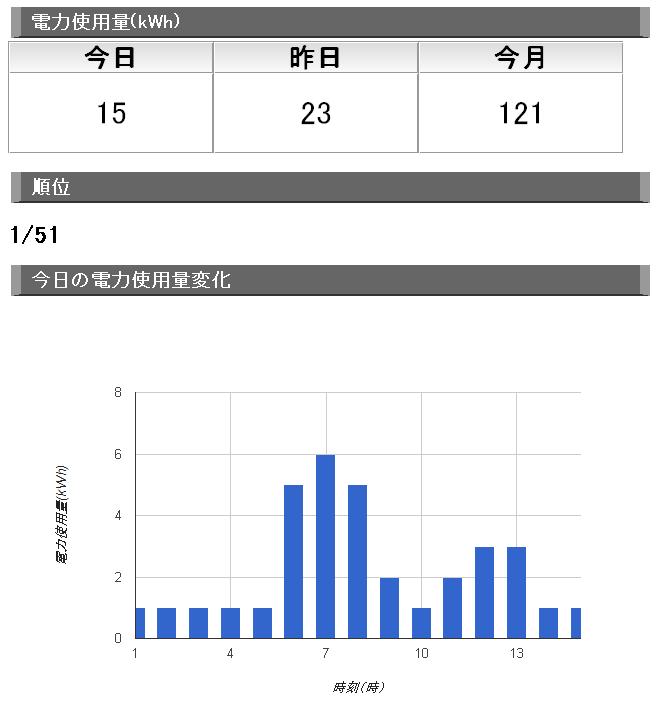
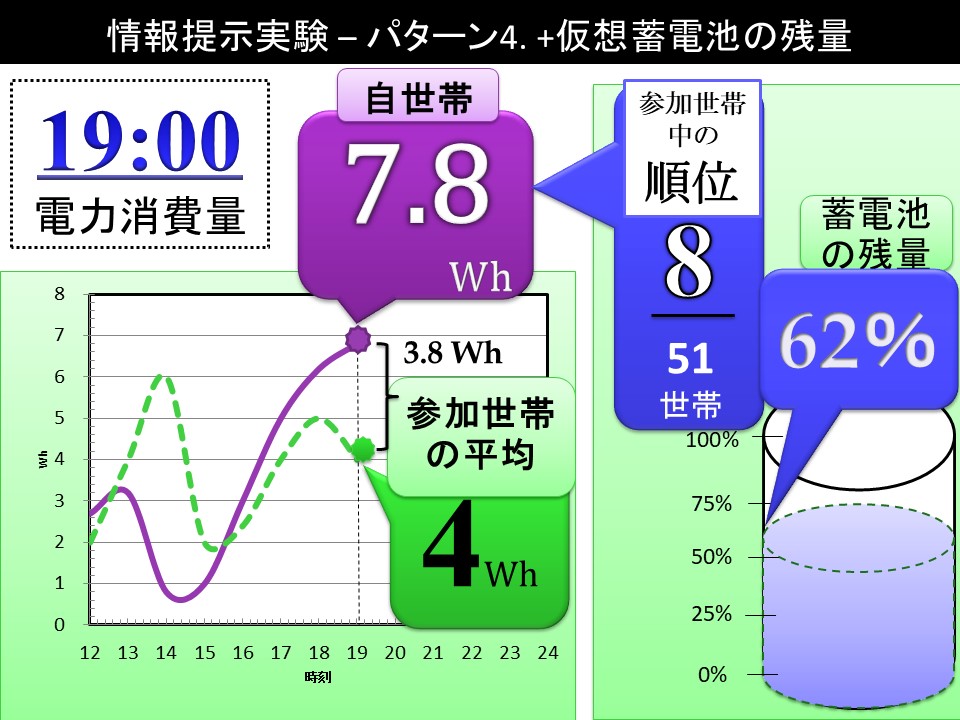
Participating households received tablet computers. The project progressively displayed each household's consumption, the participant average, ranking, a virtual battery state of charge and simulated electricity prices.
More information did not always produce a stronger conservation effect. Basic feedback on a household's own consumption was associated with lower demand on average. Ranking information could also work in the opposite direction when households that learned they were using less than others felt less need to conserve.
In the subsequent dynamic-pricing experiments, households were divided into treatment and control groups and received point allocations. The number of points deducted per kilowatt-hour varied with weather and expected generation, and remaining points could be redeemed at one yen per point.
Change the price
  ↓
Does total use decline?
Does the time of use shift?
Does behavior persist after the intervention ends?
Do all households respond together and create another peak?
An approximately 13.8% reduction and an international peer-reviewed paper
Follow-on research suggested that electricity consumption during the summer dynamic-pricing experiment was approximately 13.8 percent lower than in the pre-experiment period. It also reported that demand reduction remained after the intervention, indicating possible habit formation.
The study did not find clear evidence that demand changed in proportion to marginal point levels of 20, 30 or 40 points. Households may instead have responded to the expected total incentive.
The results were published in 2016 in Energies as “An Experimental Study of the Impact of Dynamic Electricity Pricing on Consumer Behavior: An Analysis for a Remote Island in Japan.”
According to Professor Koji Shimada, the theory of dynamic pricing was already established, but field data from real homes covering multiple seasons, a control group, financial incentives and post-intervention tracking were limited. The rarity of the Nushima data contributed to the paper's continuing citations.

- Experiment conception, design and execution: Shimada, Ochi, Matsumoto, Matsugi and Awata
- Data analysis: Nguyen and Shimada
- Manuscript preparation: primarily Nguyen
Converting an unmanageable volume of data into one-minute values
Collecting multiple measurement fields every second from 51 locations over a long period created a rapidly expanding dataset. In the computing environment normally available to the research team at the time, processing the complete dataset directly was not practical.
The consulting firm responsible for data processing reported that the raw volume was too large to handle as delivered. Kei Communication Technology therefore converted the one-second records into one-minute data. The research team then aggregated them further into hourly, daily or monthly values according to each analysis.
The hourly values used in the published research represent an analytical aggregation of only part of the data collected on Nushima. Short-duration changes removed by aggregation remain in the underlying primary records.
Internal calculations at 20 millisecond intervals
        ↓
One-second primary data with authenticated timestamps
        ↓
Conversion to one-minute data by Kei Communication Technology
        ↓
Hourly, daily and monthly research datasets
        ↓
Regression analysis and publication
Using AI to revisit primary data that remain largely unexplored
Kei Communication Technology continues to retain the large body of primary data collected during the Nushima demonstration. Limits in computing resources, budgets, databases and statistical methods meant that not every phenomenon could be analyzed at the time.
Today, distributed and parallel processing, time-series databases, machine learning, anomaly detection, clustering, causal inference, digital twins and generative-AI-assisted analysis are available.
Because the data carry authenticated timestamps, they can be partitioned by household, day or season for parallel processing and then accurately recombined on the common time axis. Solar output, storage, prices, weather and household behavior can therefore be compared at the same moments, making the dataset particularly suitable for modern analysis.
- Automatic classification of household demand patterns
- Response timing after a price notification
- Rebound demand after suppression
- Synchronization of night-time water-heating loads
- Habit formation after the intervention
- Temporal mismatch between solar generation and demand
- Optimal battery capacity and control
- Start-time inference for cooling, water heating and refrigeration
- Equipment-degradation detection from changes in operating cycles
- A digital twin of an isolated-island microgrid
Renewed analysis would require confirmation of contractual conditions, anonymization, privacy protection, research ethics and restrictions on secondary use. Retaining the data does not mean that it can be used without conditions.
Technical feasibility and the JPY 1.78 billion barrier to implementation
The demonstration operated solar generation, batteries, DC distribution, smart meters, communications, a data center, visualization and demand control as one system. It also produced a simulation model that could be applied to other regions.
A contemporaneous estimate found that making the whole of Nushima self-sufficient through a solar-centered DC power-supply system would require approximately JPY 1.78 billion in capital investment. Amortized over 20 years, that represented JPY 89 million per year. The model suggested that electricity costs could approach then-current levels if public subsidies covered two-thirds of the equipment cost.
Technical feasibility is different from the ability to maintain community infrastructure after a subsidy ends. The project did not establish a complete long-term business model covering equipment ownership, maintenance responsibility, renewal costs, tariffs, personal data and community consent, and island-wide implementation did not proceed.
An energy system cannot be designed independently without independent measurement.
But measurement alone does not create infrastructure unless ownership, operation and cost allocation are also designed.
- Independent metering and communications at 51 points
- Integration of solar generation, storage and demand
- Visualization and pricing experiments
- Testing demand reduction and habit formation
- A model applicable to other regions
- An operator after public funding ended
- Responsibility for maintenance and equipment renewal costs
- Community-wide tariff and metering rules
- Equipment ownership and allocation of responsibility
- Long-term community consent
Technical Foundation
The technology foundation behind the Nushima demonstration
The Nushima demonstration connected Smart Meter, our in-house SNMP stack and MIB, IEEE 802-based communications, a data center, solar generation and storage as one operational system.
Measurement
Smart Meter (Japanese)
A primary-data platform for one-second measurement, power quality, authenticated time and long-term retention.
Monitoring
In-house SNMP stack and MIB
The communications and monitoring foundation used to manage measurements and device status remotely.
Smart Grid Use Cases
IEEE 802.24 (Japanese)
A cross-IEEE 802 framework that organizes communications technologies from Smart Grid application requirements.
Communications
IEEE 802 and our technology
The technical lineage connecting device identity, communications, monitoring, power and maintenance.
Smart Metering & Primary Data
Build energy decisions on data measured at the source
Electricity quality, load profiles, equipment starts, solar generation, batteries and remote monitoring can be integrated only when the original measurements remain available on a reliable time axis.
Project summary, FAQ and references
| Project | Demonstration of an autonomous distributed energy system using DC technology in an isolated island and fishing village |
|---|---|
| Program | Ministry of the Environment FY2012 Program for Development and Demonstration of Global-Warming Countermeasure Technologies |
| Location | Nushima Island, Minamiawaji, Hyogo Prefecture, Japan |
| Lead organization | Kobe University |
| Our principal roles | Certified electricity meters, Smart Meter systems, in-house SNMP protocol stack and MIB, communications, data center, field installation, solar generation, Personal Energy, and experiment design and execution |
| Installed measurement points | 51 final locations |
| Measurement | Internal 20 millisecond calculations; authenticated and retained as one-second records |
| Visualization | Tablet displays of household use, average, ranking, virtual battery state of charge and simulated prices |
| Research results | Visualization, dynamic pricing, habit formation and supply-demand simulation |
| International paper | Energies 2016, 9(12), 1093 |
| Current status | Primary data retained by Kei Communication Technology; potential AI reanalysis subject to the required conditions |
What was measured on Nushima Island?
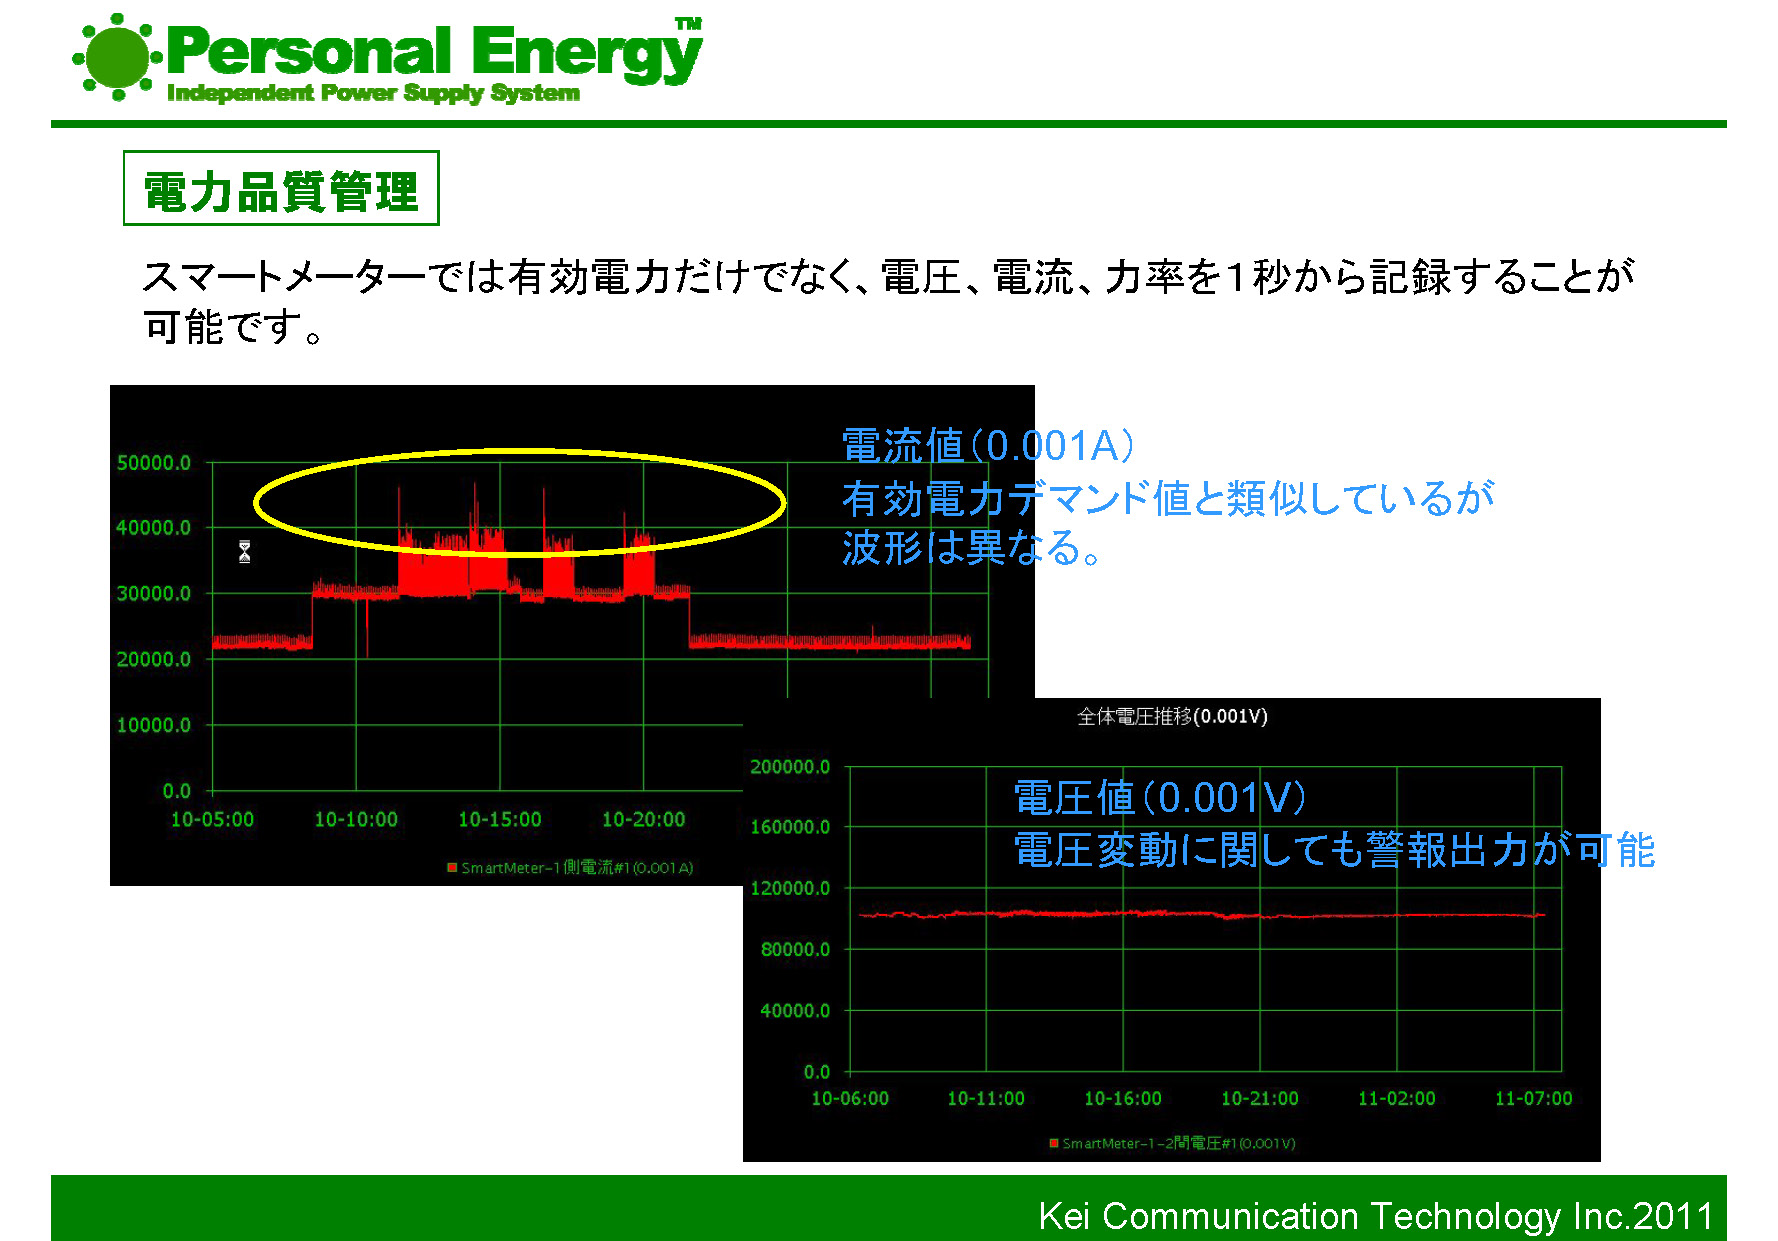
Independent digital certified electricity meters and smart meters were installed at 51 final measurement points. Whole-house electricity use was collected at one-second intervals, while voltage, current, active power and power factor were recorded by the same system.
How were Smart Meter and SNMP related?
The Smart Meter systems at 51 locations incorporated our in-house SNMP protocol stack and MIB. Measurement values and device status were collected through 3G and VPN connections to our data center for remote monitoring, retention and visualization.
How does it differ from the current B-route?
B-route services provide 30-minute accumulated energy and values such as instantaneous power and current to customer-side equipment. Some second-generation meters can provide one-minute accumulated values. Nushima differs because one-second primary data from 51 locations were retained continuously on a common time axis, allowing later analysis of equipment starts and synchronized demand.
Was the whole island converted to off-grid operation?
No. Solar generation and Personal Energy at the branch office produced simulated generation and storage data, which were combined with measured residential demand to model island-wide expansion.
Is the approximately 13.8% reduction a definitive result?
It is a research result suggesting an approximately 13.8 percent reduction during the summer experiment. It must be interpreted with the experimental conditions, sample, statistical significance and incentive design. It does not guarantee the same effect under ordinary tariffs.
Can the data be reanalyzed with AI?
Technically, yes. Any project would require confirmation of contracts, permitted purposes, anonymization, privacy protection and research ethics.
Data & Energy Systems
From 30-minute visualization to one-second equipment and demand analysis
Power quality, demand profiles, equipment starts, solar generation, batteries and remote monitoring: energy systems can be redesigned from a primary-data foundation measured independently at the source.
- Ministry of the Environment, FY2012 selection materials for the Program for Development and Demonstration of Global-Warming Countermeasure Technologies (Japanese)
- Hyogo Prefectural Institute of Technology, “Demonstration of an Autonomous Distributed Energy System Using DC Technology in an Isolated Island and Fishing Village” (Japanese)
- Nguyen et al., “An Experimental Study of the Impact of Dynamic Electricity Pricing on Consumer Behavior: An Analysis for a Remote Island in Japan,” Energies 2016, 9, 1093.
- Hyogo Prefectural Institute of Technology, Application Example Vol. 10 (Japanese)
- Agency for Natural Resources and Energy, Q&A on the Electricity Metering System (Japanese)
- Kansai Transmission and Distribution, Smart Meters (Japanese)
- Kansai Transmission and Distribution, Low-Voltage B-Route Service and Data Items (Japanese)